In [2]:
%plot gnuplot
In [2]:
clear all
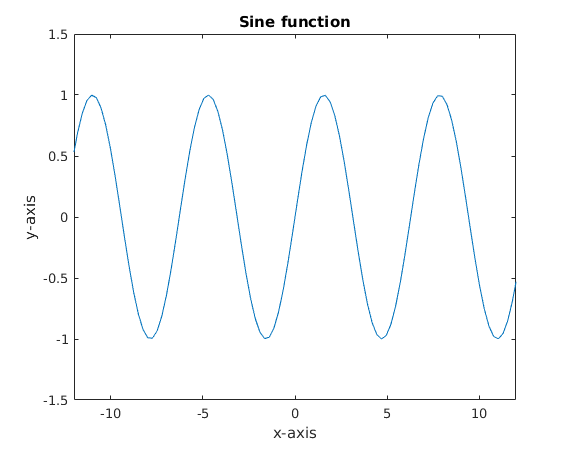
x = linspace(-4*pi, 4*pi, 100);
plot (x, sin (x));
xlabel('x-axis')
ylabel('y-axis')
title('Sine function')
axis([-12, 12, -1.5, 1.5])

In [3]:
clear all
figure(2)
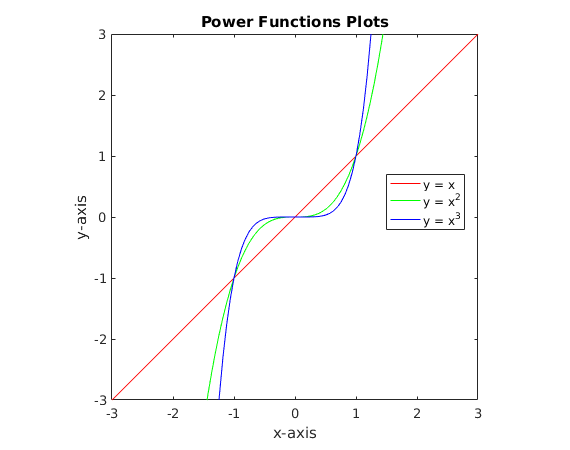
x = linspace(-3, 3, 100);
y1 = x;
y2 = x.^3;
y3 = x.^5;
plot(x, y1, 'r')
hold on
plot(x, y2, 'g')
hold on
plot(x, y3, 'b')
axis('equal')
xlabel('x-axis')
ylabel('y-axis')
title('Power Functions Plots')
axis([-3, 3, -3, 3])
legend('y = x','y = x^2','y = x^3')
hold off

In [4]:
clear all
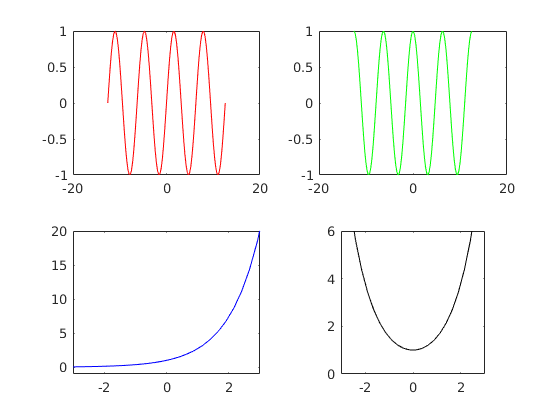
x = linspace(-4*pi, 4*pi, 100);
y1 = sin(x);
y2 = cos(x);
y3 = exp(x);
y4 = cosh(x);
subplot(2,2,1)
plot(x, y1, 'r')
subplot(2,2,2)
plot(x, y2, 'g')
subplot(2,2,3)
plot(x, y3, 'b')
axis([-3, 3, -1, 20])
subplot(2,2,4)
plot(x, y4, 'k')
axis('equal')
axis([-3, 3, 0, 6])

In [1]:
tx = ty = linspace (-8, 8, 41);
[xx, yy] = meshgrid (tx, ty);
r = sqrt (xx .^ 2 + yy .^ 2) + eps;
tz = sin (r) ./ r;
In [3]:
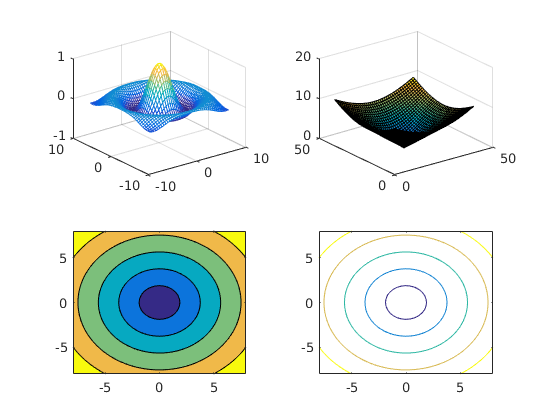
subplot(2,2,1)
mesh (tx, ty, tz);
subplot(2,2,2)
surf(r)
subplot(2,2,3)
contourf(xx,yy,r,5)
subplot(2,2,4)
contour(xx,yy,r,5)
