Complex Function
In [2]:
%plot gnuplot
In [3]:
clear all
Lx = 4.0;  Ly = 4.0;
dx = 0.1;
x = -Lx:dx:Lx;
y = -Ly:dx:Ly;

[xx,yy] = meshgrid(x,y);
zz = xx + 1i*yy;  %%%Up to this point the complex mesh is created
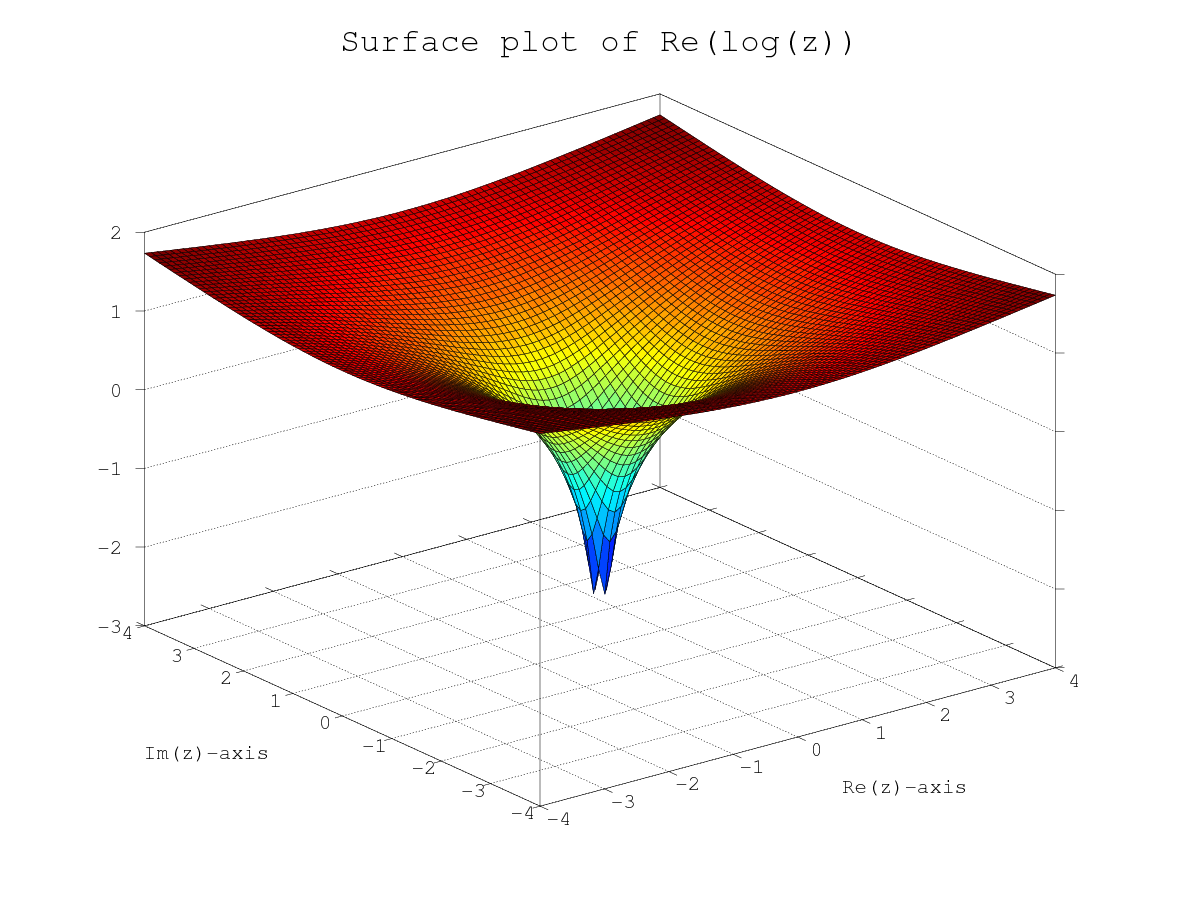
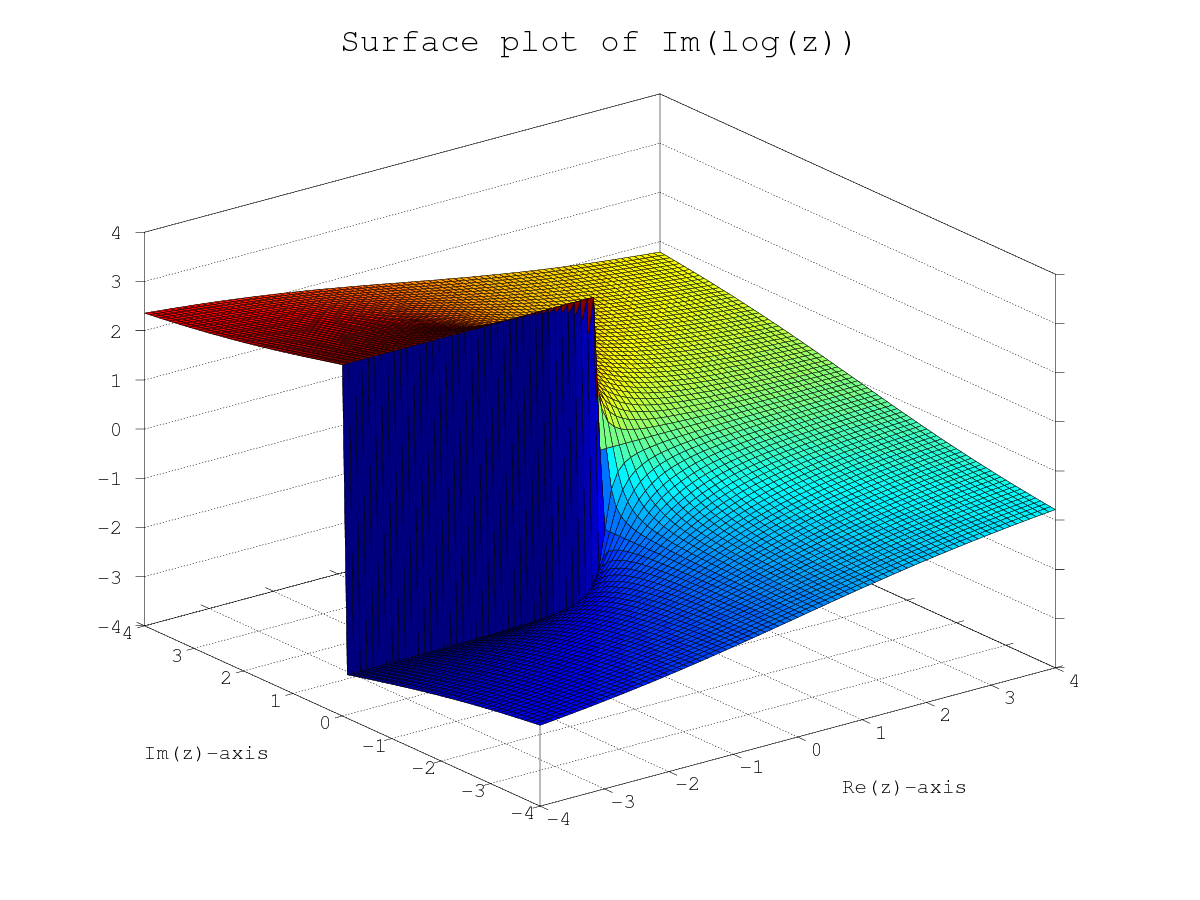
phi=log(zz);

figure(1001)
surf(xx,yy,real(phi))
axis([-Lx Lx -Ly Ly])
xlabel('Re(z)-axis')
ylabel('Im(z)-axis')
title('Surface plot of Re(log(z))','fontsize',16)

figure(1002)
zz = xx + 1i*yy;  %%%Up to this point the complex mesh is created
surf(xx,yy,imag(phi))
axis([-Lx Lx -Ly Ly])
xlabel('Re(z)-axis')
ylabel('Im(z)-axis')
title('Surface plot of Im(log(z))','fontsize',16)

contn = 10; %How may contours you want to plot?
%  imag part
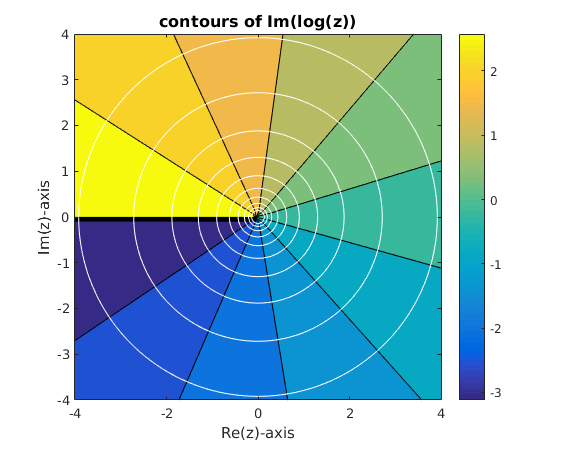
figure(12);  clf;
contourf(x,y,imag(phi),contn);  hold on
contour(x,y,real(phi),contn,'w');
hold off
colorbar
axis equal
axis([-Lx Lx -Ly Ly])
xlabel('Re(z)-axis')
ylabel('Im(z)-axis')
title('contours of Im(log(z))','fontsize',16)

%  real part
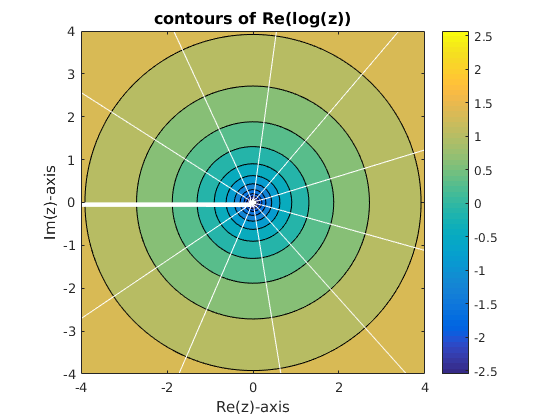
figure(22);  clf;
contourf(x,y,real(phi),contn);  hold on
contour(x,y,imag(phi),contn,'w');
colorbar
axis equal
axis([-Lx Lx -Ly Ly])
xlabel('Re(z)-axis')
ylabel('Im(z)-axis')
title('contours of Re(log(z))','fontsize',12)

|

|
|---|---|

|

|